March 8, 2013 From rOpenSci (https://deploy-preview-488--ropensci.netlify.app/blog/2013/03/08/ropensci-collaboration/). Except where otherwise noted, content on this site is licensed under the CC-BY license.
We have been writing code for R packages for a couple years, so it is time to take a look back at the data. What data you ask? The commits data from GitHub ~ data that records who did what and when.
Using the Github commits API we can gather data on who commited code to a Github repository, and when they did it. Then we can visualize this hitorical record.
We’ll need some functions for interacting with the Github API via R
install_github('sandbox', 'ropensci')

library(sandbox)
library(httr)
library(ggplot2)
library(scales)
library(reshape2)
library(bipartite)
library(doMC)
library(plyr)
library(ggthemes)
library(picante)

# And authenticate - pops open a page in your default browser, then tells
# you authentication was successful
github_auth()
Get all repos for an organization, here ropensci of course
ropensci_repos <- github_allrepos(userorg = "ropensci")
Get commits broken down in to additions and deletions, though below we just collapse them to all commits
registerDoMC(cores = 4)
github_commits_safe <- plyr::failwith(NULL, github_commits)
out <- llply(ropensci_repos, function(x) github_commits_safe("ropensci", x,
    since = "2009-01-01T", limit = 500), .parallel = TRUE)
names(out) <- ropensci_repos
out2 <- compact(out)
outdf <- ldply(out2)
Plot commits by date and repo
outdf_subset <- outdf[!outdf$.id %in% c("citeulike", "challenge", "docs", "ropensci-book",
    "usecases", "textmine", "usgs", "ropenscitoolkit", "neotoma", "rEWDB", "rgauges",
    "rodash", "ropensci.github.com", "ROAuth"), ]
outdf_subset$.id <- tolower(outdf_subset$.id)
outdf_subset <- ddply(outdf_subset, .(.id, date), summarise, value = sum(value))

mindates <- llply(unique(outdf_subset$.id), function(x) min(outdf_subset[outdf_subset$.id ==
    x, "date"]))
names(mindates) <- unique(outdf_subset$.id)
mindates <- sort(do.call(c, mindates))
outdf_subset$.id <- factor(outdf_subset$.id, levels = names(mindates))

ggplot(outdf_subset, aes(date, value, fill = .id)) +
    geom_bar(stat = "identity", width = 0.5) +
    geom_rangeframe(sides = "b", colour = "grey") +
    theme_bw(base_size = 9) +
    scale_x_date(labels = date_format("%Y"), breaks = date_breaks("year")) +
    scale_y_log10() +
    facet_grid(.id ~ .) +
    labs(x = "", y = "") +
    theme(axis.text.y = element_blank(),
        axis.text.x = element_text(colour = "black"),
        axis.ticks.y = element_blank(),
        strip.text.y = element_text(angle = 0, size = 8, ),
        strip.background = element_rect(size = 0),
        panel.grid.major = element_blank(),
        panel.grid.minor = element_blank(),
        legend.text = element_text(size = 8),
        legend.position = "none",
        panel.border = element_blank())

gistr map
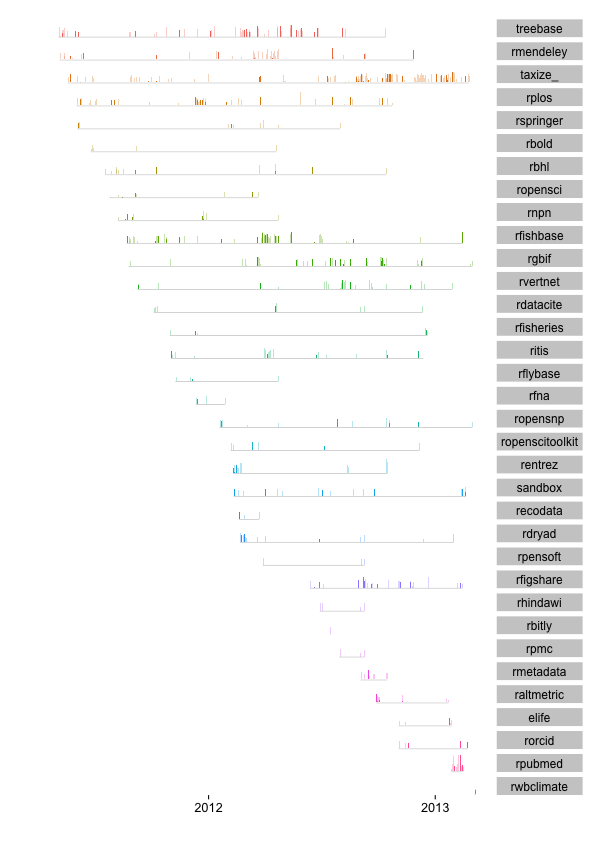
The plot above plots the sum of additions+deletions, and is sorted by the first commit date of reach repo, with the first being treebase, which wraps the Treebase API, and the most recent being rwbclimate, which wraps the World Blank climate data API.
You can see that some repos have recieved commits more or less consistently over their life time, while others have seen a little development here and there.
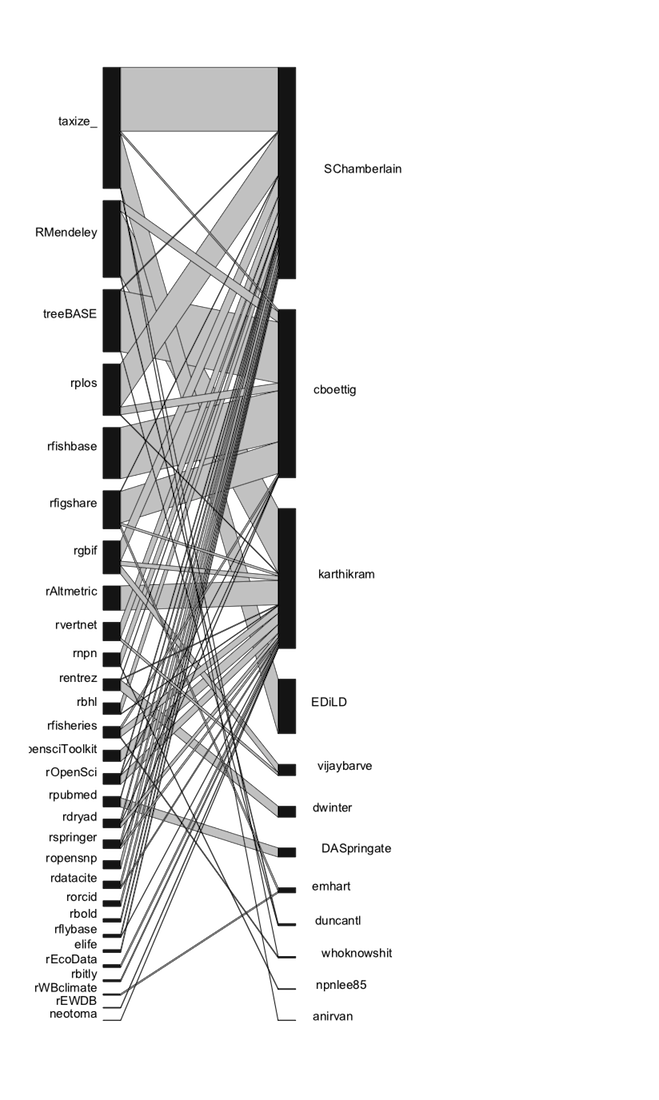
In addition, there are quite a few people that have committed code now to rOpenSci repos, calling for a network vizualization of course.
outdf_network <- droplevels(outdf[!outdf$.id %in% c("citeulike", "challenge",
    "docs", "ropensci-book", "usecases", "textmine", "usgs", "ropenscitoolkit",
    "retriever", "rodash", "ropensci.github.com", "ROAuth", "rgauges", "sandbox",
    "rfna", "rmetadata", "rhindawi", "rpmc", "rpensoft", "ritis"), ])
casted <- dcast(outdf_network, .id + date + name ~ variable, fun.aggregate = length,
    value.var = "value")
names(casted)[1] <- "repo"
casted2 <- ddply(casted, .(repo, name), summarise, commits = sum(additions))
casted2 <- data.frame(repo = casted2$repo, weight = casted2$commits, name = casted2$name)
mat <- sample2matrix(casted2)
plotweb(sortweb(mat, sort.order = "dec"), method = "normal", text.rot = 90,
    adj.high = c(-0.3, 0), adj.low = c(1, -0.3), y.width.low = 0.05, y.width.high = 0.05,
    ybig = 0.09, labsize = 0.7)

gistr map
The plot above shows repos on one side and contributors on the other. Some folks (the core rOpenSci team: cboettig, karthikram, emhart, and sckott) have committed quite a lot to many packages. We also have many awesome contributors to our packages (some contributors and repos have been removed for clarity).
rOpenSci is truly a collaborative effort to develop tools for open science, so thanks to all our contributors - keep on forking, pull requesting, and commiting.

