June 19, 2013 From rOpenSci (https://deploy-preview-488--ropensci.netlify.app/blog/2013/06/19/usgs-app/). Except where otherwise noted, content on this site is licensed under the CC-BY license.
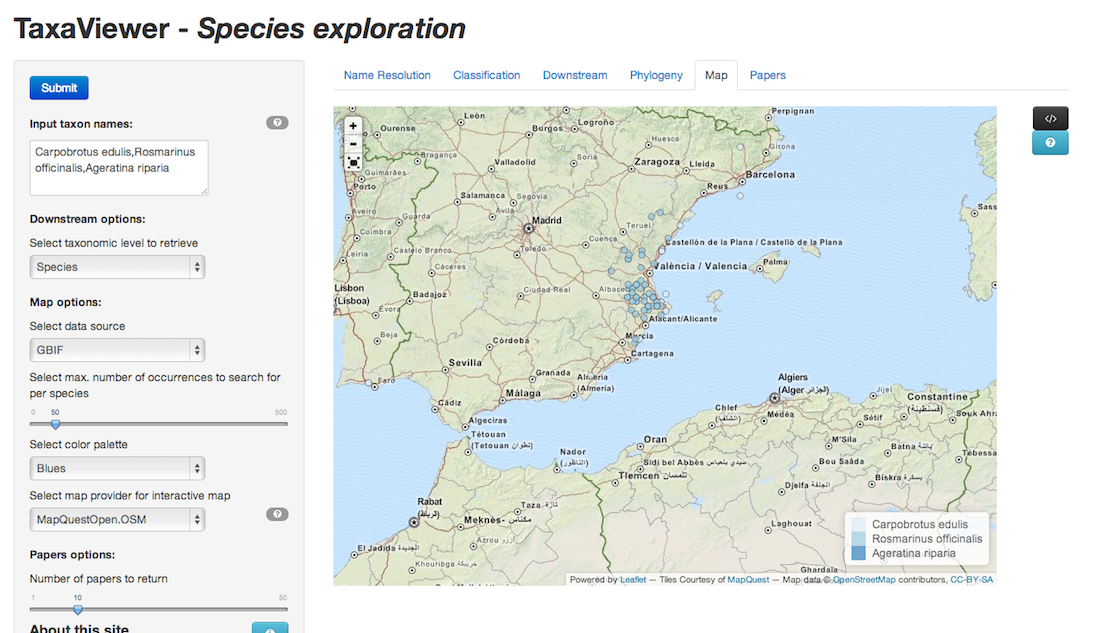
R has a reputation of not playing nice on the web. At rOpenSci, we write R pacakages to bring data from around the web into R on your local machine - so we mostly don’t do any dev for the web. However, the United States Geological Survey (USGS) recenty held an app competition - it was a good opportunity to play with R on the web. We won best overall app as described in an earlier post on this blog. Check out our app TaxaViewer at https://ropensci.shinyapps.io/taxaviewer/. Last week we presented the app to the USGS - a video of the presentation will be coming soon. A screenshot:

When we submitted the app we had static ggplot2 maps, but now the app has interactive maps that are a much better fit for a browser that isn’t restrained to static images. Ramnath Vaidyanathan helped us use rCharts to pass data from queries to the GBIF and BISON APIs to functions in rCharts to prepare the map page you see in the app. rCharts isn’t restricted to just maps - think interactive bar charts, scatter plots, etc.
We didn’t originally have a tab for searching for mentions of taxonomic names in the literature - we added it in later (see the Papers tab on the app), and people really liked it, suggesting that’s something we should explore more. How does it work? We take the list of taxonomic names input in the text box in the upper left, and query the PLOS search API, and return a table of papers listing the journal name and paper title. We provide a link to open an article from the search results in Macrodocs (thx @invisiblecomma!), like this example. We chose PLOS as they have a relatively large set of articles, and they are all open access = immediate access to the text. Any interest in an app just for literature? Maybe litereature + metadata? And perhaps some text mining using the tm package?
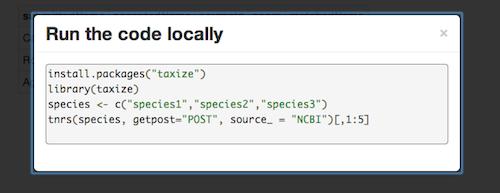
We think of the USGS app as a visual interface to show what can be do in R on the command line, and give the code to do it. See the code (</>) buttons that drop down in this screenshot below. This is a compelling use case for Shiny apps - show people what they can do visually - then give them the code to do it on their own machine.


